What is InfraVis and why do we need this kind of research infrastructure?
“InfraVis is a new national research infrastructure for the visualization and analysis of scientific data. However, it is not made up of hardware in the form of computers and microscopes, but instead expertise and people. We are offering visualization expertise to support other researchers. Nine higher education institutions are participating with Chalmers University of Technology as the host university, and we will have around 20 full-time posts divided among many individuals at various rates of engagement, including myself.
“Sweden needs this research infrastructure to make it easier for researchers to visualize scientific data and is part of efforts to strengthen Sweden’s competitiveness in the era of large-scale data. Because although the latest technology in data visualization is available at a number of our universities, it can be difficult for the individual researcher to get up and running in using it, because it requires expertise, time and resources. The visualization process consists of exploring, transforming, and viewing large amounts of data as images. In addition, visualization is often interactive. We don’t always try to create photorealistic images, but instead visualize the data in an informative way, which is a highly context-dependent task.”
In what areas will you offer visualization support?
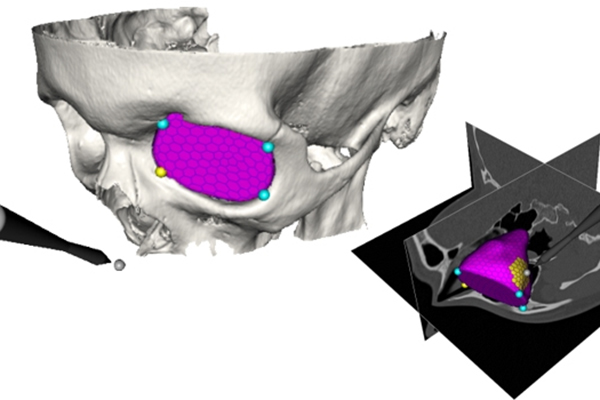
“InfraVis will offer expertise across a broad spectrum of areas. In my case, mainly in the visualization of medical data such as whole-body images, maxillo-facial parts or blood vessels. But it could be visualizing molecules in materials engineering, chemistry or pharmacy, or visualizing economic flows or data in the field of digital humanities. We welcome requests from all researchers in Sweden and in everything from humanities and archaeology to life sciences, medicine and engineering.
“For example, there might be a researcher who extracts data from one of the beamlines at the MAX IV synchrotron radiation light source in Lund. When the researcher contacts InfraVis, they will be directed to a hub that keeps track of all visualization experts at the participating universities. The researcher is then put in contact with appropriate expertise and gets help in visualizing their data, for example, time flows or scales adapted to human colour perception. Visualization is not a substitute for but a complement to statistical analysis and other quantitative methods. It’s another way for researchers to be able to detect and comprehend anomalies and patterns and get even more useful information from their data analysis. Within InfraVis we will also have a big focus on courses, training and workshops to offer the researchers additional skills development of their own.”
How does InfraVis connect with research at Uppsala University?
“We have a long history of research in the visualization area at Uppsala University linked to our Centre for Image Analysis that has had a variety of applications and focuses. Currently, three professors from the Department of Information Technology are involved in InfraVis: Stefan Seipel, Anders Hast and myself. Stefan’s focus is on interactive visualizations of geographic and spatial data, such as maps, urban environments and buildings. For many years Anders has worked as an application expert in visualization at UPPMAX (Uppsala Multidisciplinary Centre for Advanced Computational Science) and has also established strong ties with the Centre for Digital Humanities and worked on handwritten text recognition in recent years. I myself have a large network in medicine and have research collaborations with radiologists as well as surgeons. Uppsala University’s participation in InfraVis is proof that we have strong research in visualization. Although the funding is there to support other researchers, I definitely believe that new ideas for research will be generated through contacts coming thanks to InfraVis.”
What’s next for you?
“Currently, we are in the process of writing agreements with the Swedish Research Council and between the higher education institutions. In November, we will have an internal kick-off where we will determine who does what in the collaboration that we have built up over several years already as well as what new recruitments we need to make in the first instance. Visualization support will be operational from January 2022.
“Something else that we are very much looking forward to at Uppsala University is the move into our new building Nya Ångström, an extension of the Ångström Laboratory. In February, it will be our turn to move the Department of Information Technology. The entrance floor of Nya Ångström will house a new 100 square metre visualization theatre, Theatrum Visuale, with a four-metre high ceiling. The plan is to equip the theatre with screens for using advanced 3D technology in interactive teaching, research presentations, company and school visits and other activities. It will be a very exciting environment for our campus! I’m also looking forward to holding workshops for researchers from InfraVis across the nation in our theatre.”